RX 6700 XT VS RX 6800 – Comparison
Finally, the AMD’s new RX 6700 XT graphics card has arrived, but how does it compare against the next level 6800. Which one is worth buying?
I’ve tested both of these cards and compared them in ten different games at 1080p, 1440p, and 4K resolutions to show you the differences in results.
RX 6700 XT vs RX 6800 – Specifications
The RX 6800 has more memory, the memory is faster, uses more power, has 50% more compute units, more stream processors, but its clock speeds aren’t as high as the RX 6700 XT.
The RX 6800 is a higher-tier card, so we expect it to be better in most aspects.
| RX 6700 XT | RX 6800 | |
|---|---|---|
| Stream Processors | 2560 | 3840 |
| Computer Units | 40 | 600 |
| Texture Units | 160 | 240 |
| ROPS | 64 | 96 |
| Boost Clock | 2581Mhz | 2105Mhz |
| Memory | 12GB GDDR6 | 16GB GDDR6 |
| Memory Bandwidth | 384 GB/s | 512 GB/s |
| Memory Interface | 192-Bit | 256 – Bit |
| TGP | 230W | 250W |
Specs of the Test PC I Used
Following are the specifications of the system I used to test both graphics cards. Both GPUs are tested with the same drivers and Windows updates.
| Graphics | RX 6700 XT / RX 6800 |
| CPU | Intel i9-10900k @5.2Ghz |
| Motherboard | MSI Z490 ACE |
| Memory | 32GB DDR4-3200 CL 14 Dual Channel |
| CPU Cooler | Fractal S36 AIO |
| Thermal Paste | Noctua NT-H2 |
| Storage | 2TB Seagate Firecuda NVME M.2 SSD |
| Case | NZXT H700i |
| Power Supply | Corsair HX850i |
Pricing
Check the latest Price on Amazon using the links below.
Temp/Clock speed/Power draw
Before we get into the details, you need to know that despite both being two-slot cards of a very similar size, the RX 6800 weighs 500g (1.1lb) more than the RX 6700 XT. So, it’s got more metal for cooling, plus it’s also got a third Team Rocket fan.
The RX 6800 is the cooler graphics card with a game running for at least half an hour. This is with the fans in both cards running at the same speed. Even the higher temperature isn’t anything I’d be worried about.
Check out: 6 Core vs. 8 Core CPU for Gaming

The 6700 XT is hitting higher clock speed in this game, which is expected based on what we saw when comparing the specs just before.

The 6800 is also running cooler despite the system with it installed pulling more power from the wall. In a specific game (shown below) at 4K, the 6800 uses 7% more wattage.
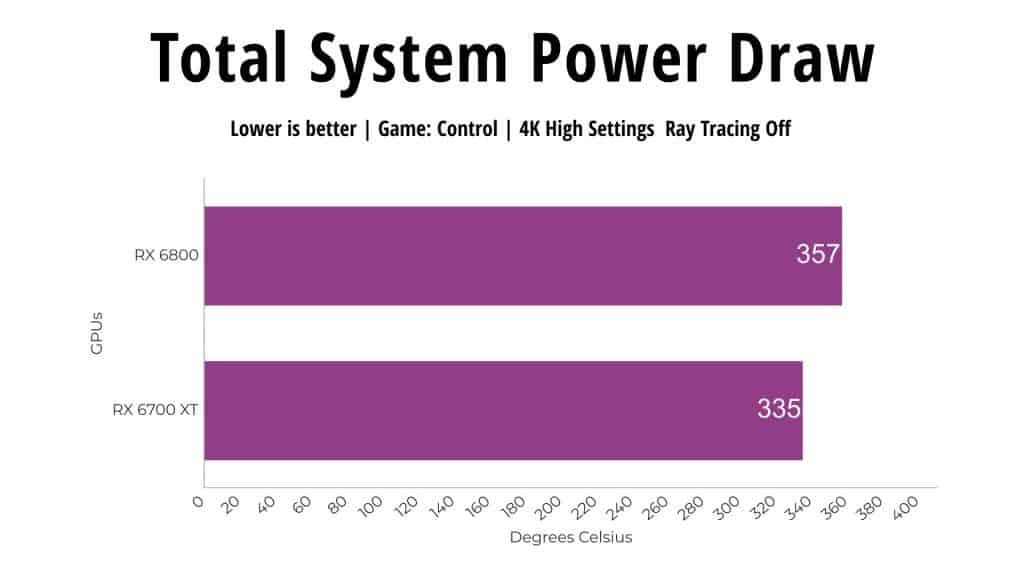
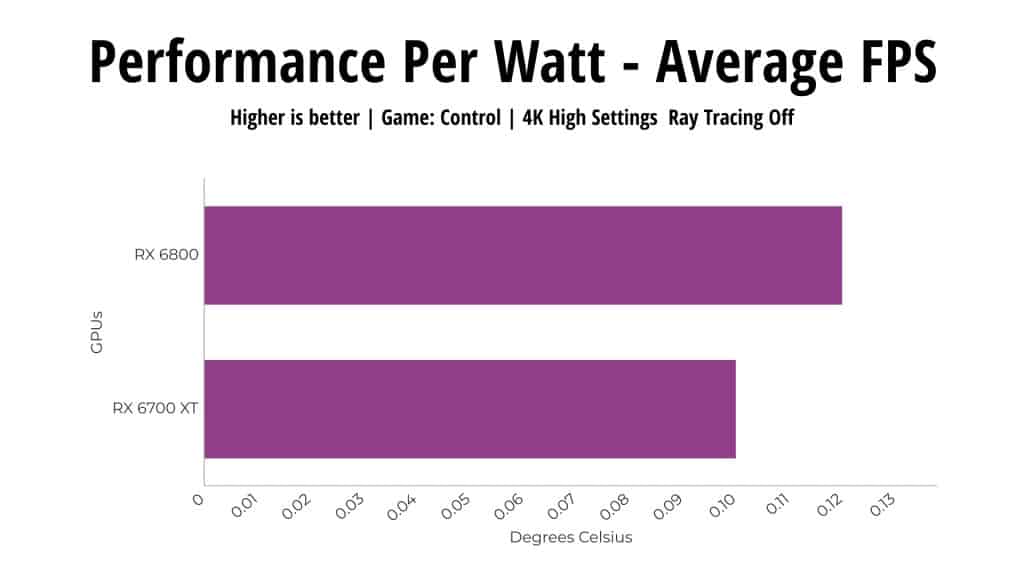
In Control the 6800 is also reaching 27% higher average FPS, and this results in the 6800 offering better performance per watt (test results are down below).
Gaming Benchmarks
So, with that in mind, let’s get straight into the gaming benchmarks with ten games at three different resolutions. Afterward, we’ll look at things like pricing & availability, content creation workloads, and more.
Also Read: Best Screen Resolution for Gaming
Red Dead Redemption 2
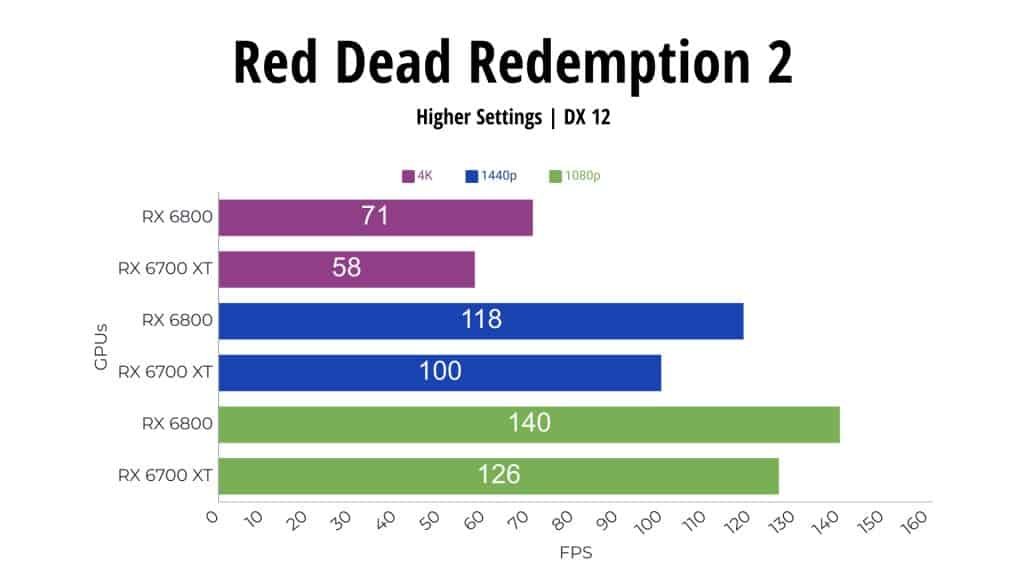
Red Dead Redemption 2 is tested using the game’s benchmark. At 1080p, the 6800 reached just 11% higher average FPS than the newer 6700 XT, which is one of the smaller differences out of the games covered.
This increases to a 19% lead at 1440p because generally higher resolutions can take better advantage of the GPU, while 4K is now 23% faster on the 6800, though the 6700 XT isn’t too far behind 60 FPS with the high preset.
Cyberpunk 2077
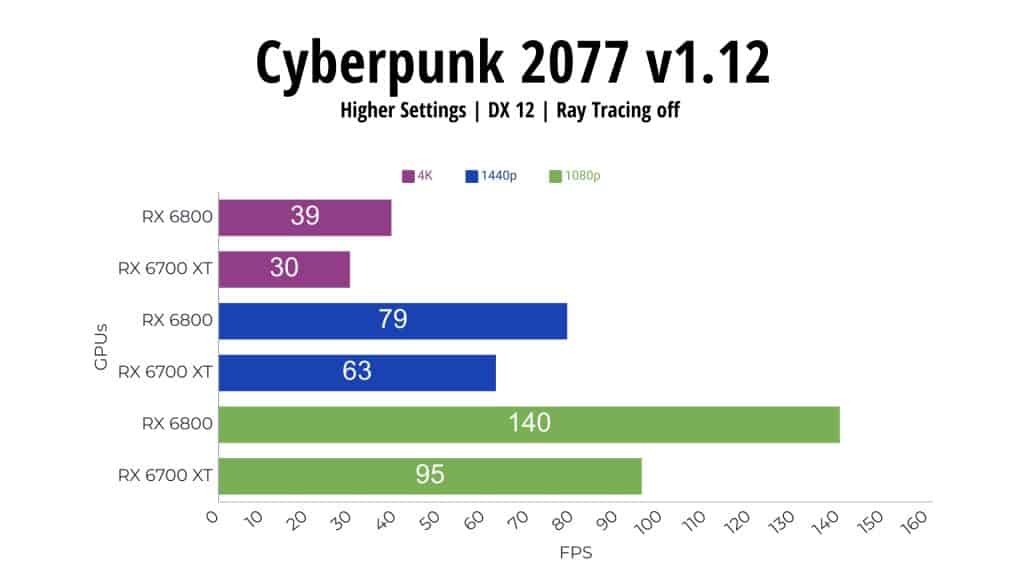
Cyberpunk 2077 is tested in little China with the street kid life path. Despite these new RX 6000 series GPUs having ray tracing support, this isn’t currently a game that’s supported. So, I’ve only been able to test it without ray tracing.
The 6800 is doing better in this game. Its 1% lows were above the average FPS of the 6700 XT at 4K and 1440p resolutions and close to it at 1080p.
In terms of average FPS, the 6800 is 22% higher at 1080p and 25% higher at 1440p, decent gains, but it also costs more.
Also Read: 1080p vs 1440p vs 4k for Gaming
Control
Control is tested with and without ray tracing. This game seems fairly GPU heavy, which explains why it saw one of the largest differences out of all ten titles tested. The 6800 reached 27% higher average FPS at 1080p and then even better at higher resolutions.
To be fair, the 6700 XT is still more than playable even with max settings 1440p, so it depends on what level of performance you’re targeting.
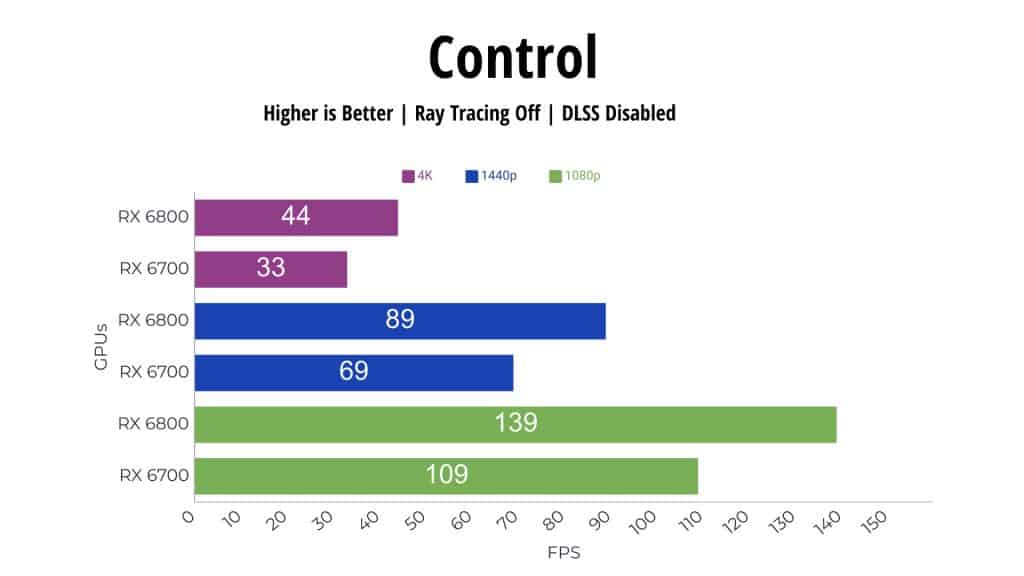
Performance dips down with ray tracing enabled. Unlike NVidia, there’s no DLSS support here, so we’re not able to boost performance.
That said, both were playing quite well at 1080p. You can use lower settings for higher resolutions. With ray tracing on, the 6800 is 30% ahead of the 6700 XT at 1440p and 28% higher at 1080p.

Microsoft Flight Simulator
Microsoft Flight Simulator is tested in the Sydney landing challenge. This game saw the smallest difference out of all ten titles at 1080p. The largest difference is at 4K, where the 6800 reached a 37% higher average frame rate.
The 6800 is 12% ahead at 1440p, one of the smallest changes at this resolution. Though still nowhere near as minor of a difference compared to the 1080p results.

Assassin’s Creed Valhalla
Assassin’s Creed Valhalla is tested with the game’s benchmark and saw the smallest differences between these two graphics cards out of all games covered at both 1440p and 4K.
The flight simulator only beat it for smallest difference at 1080p, so not too much to gain with the higher tier 6800 here, at least when compared to the other games, we’re looking at.

Watch Dogs Legion
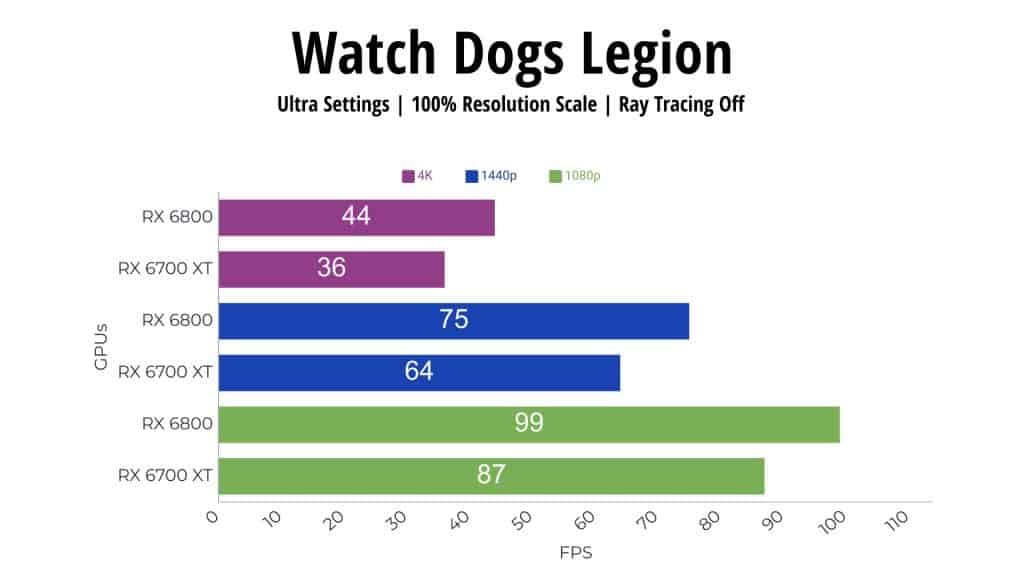
Watch Dogs Legion is also tested with the game’s benchmark. The gap between the two GPUs is a little larger here, however still below the average of the ten games covered.
The 6700 XT can still surpass 60 FPS with the highest ultra-setting preset in this test, while the 6800 is reaching 17% higher average FPS.
Fortnite
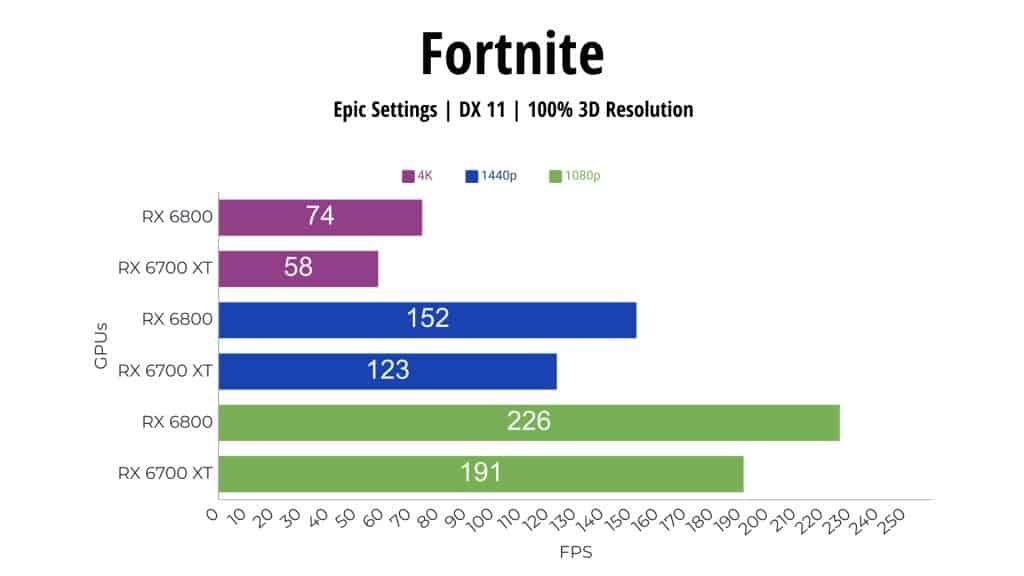
Fortnite is tested with the replay feature using the same replay file with both cards. This is a more middle-of-the-pack result and close to the average of the ten games tested.
The 6700 XT is just below that sweet 60 FPS with the highest epic setting preset at 4K. Again, you could lower the settings to boost this significantly. Over 100 FPS is achieved at 1440p max settings, where the 6800 is able to offer 23% higher average frame rate. The boost to 1% lows is also much higher at 1440p and 4K compared to 1080p.
Battlefield V
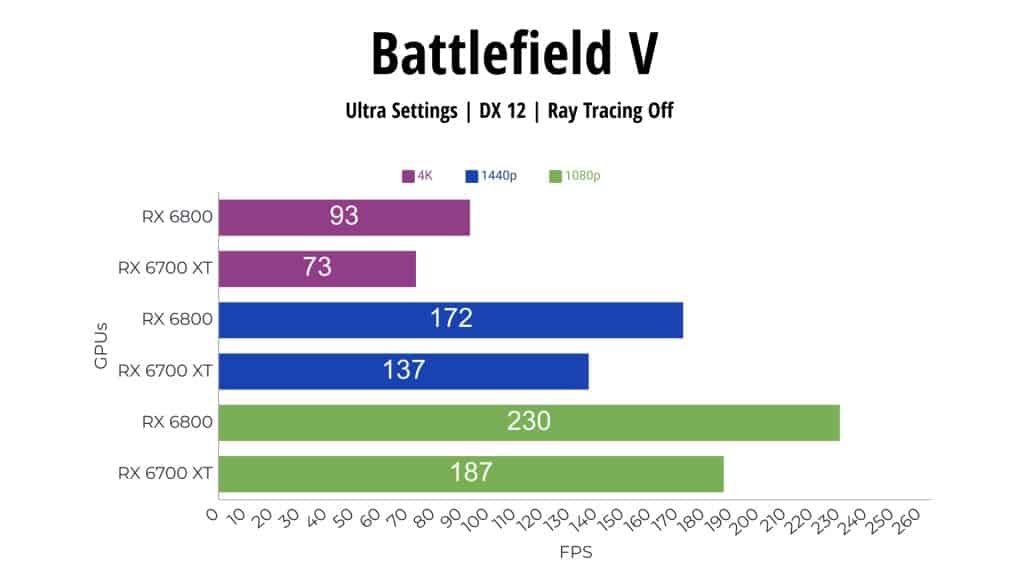
Battlefield V is tested in campaign mode. 1% lows from the 6800 were ahead of even the average FPS of the 6700 XT at all resolutions by a fair amount. However, it’s not like the 6700 XT is offering poor performance.
Even at 4K max settings, its 1% low is above 60 FPS, but this is an older game compared to most of the others previously covered, so I suppose that’s expected with newer hardware at this level.
Shadow of the Tomb Raider
Shadow of the Tomb Raider is tested with the game’s benchmark. Not quite 60 FPS with max settings at 4K in this test, the 6800 is reaching 23% higher average FPS here, still 22% higher at 1440p, and then just 13% higher at the lower 1080p resolution.

Witcher 3
The Witcher 3 is another game where 1% lows from the 6800 could beat even the average FPS from the 6700 XT regardless of the resolution, but the 6700 XT is still running just fine, even at 4K max settings in any case.
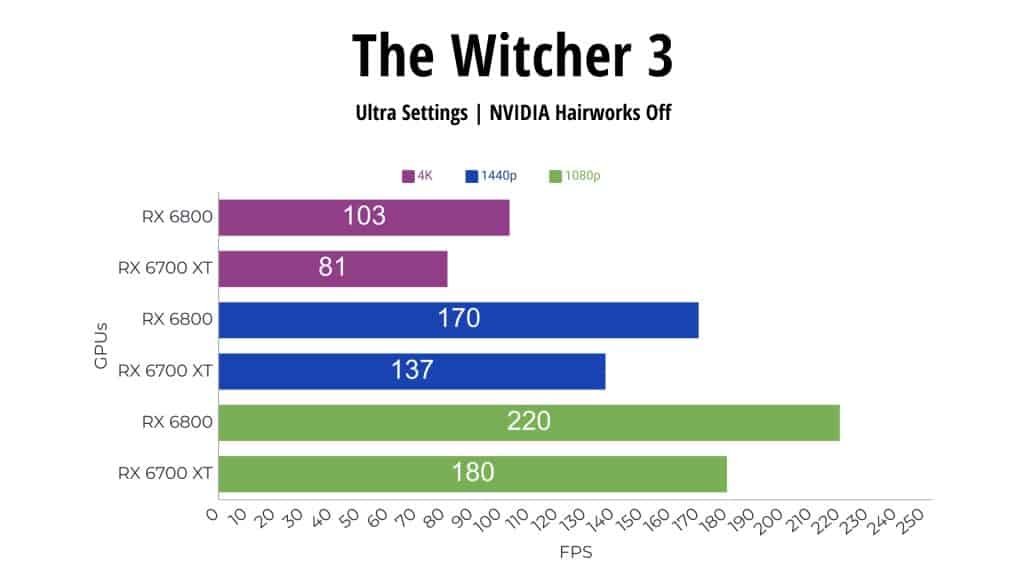
6700 XT vs 6800 (1080p/1440p/4k)
Below are the differences in all ten games that I tested between the RX 6800 and the RX 6700 XT at 1080p.
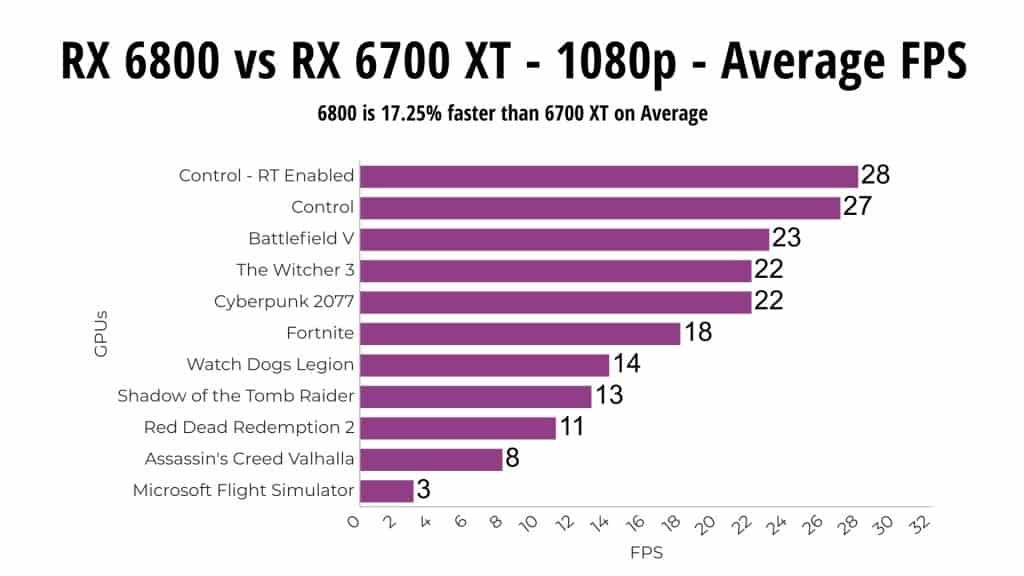
The 6800 is around 17% faster on average in these games, though some games like flight simulator down the bottom saw much smaller differences. While GPU heavy games like Control were up top and just shy of performing 30% better with the 6800.
Stepping up to 1440p and the 6800 is now almost 22% better on average.

We’re expecting the difference between the two graphics cards to widen at higher resolutions as this is more demanding on the GPU. Even the games that saw the smallest improvement are now reaching 12% higher average FPS with the 6800. A fair bit higher than the slight 2% boost we saw in the worst case at 1080p.
This continues at 4K, where the 6800 is now 27% faster than the 6700 XT on average in these ten games.

Even worst-case, we’re looking at close to a 20% boost minimum, and the Microsoft Flight Simulator, which saw the smallest difference at 1080p, now sees the biggest difference at this resolution.
Content Creator (premiere/resolve/Blender)
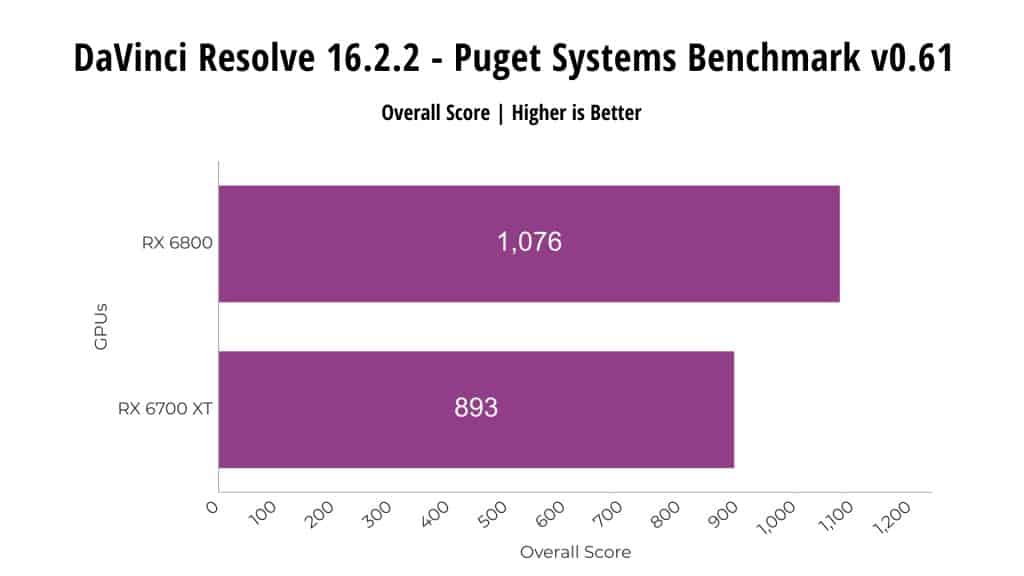
I’ve also tested some content creator workloads to get an idea of what the difference is outside gaming. I’ve tested DaVinci Resolve with the Puget Systems benchmark. This test generally seems to be fairly GPU heavy, so the 6800 can score 20% higher than the 6700 XT.
Check out Gigabyte Aero 15 for Content Creation
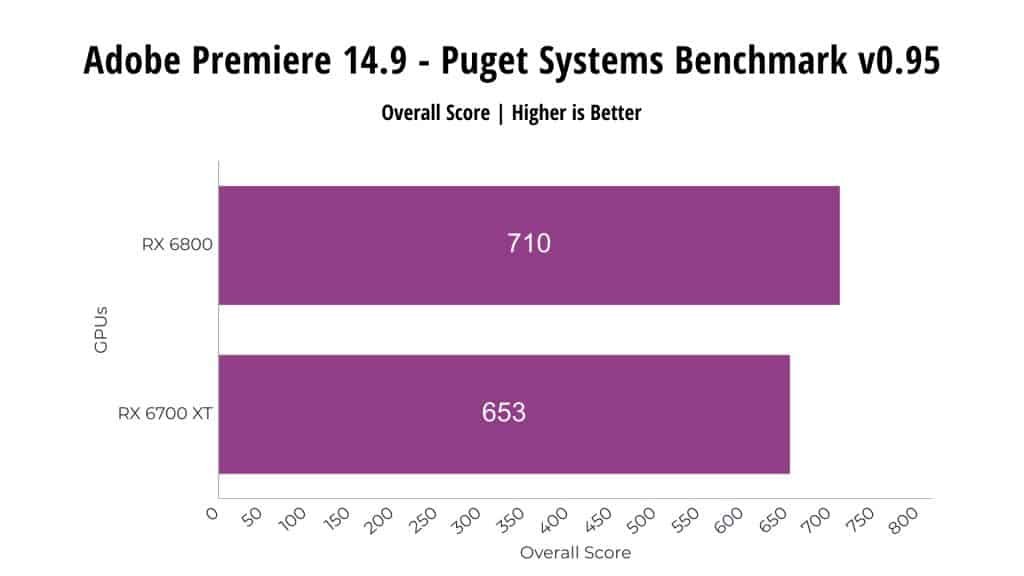
Adobe Premiere is also tested with the Puget systems benchmark. However, the GPU seems to be less of a factor here, which is why the 6800 is scoring less than 9% higher.
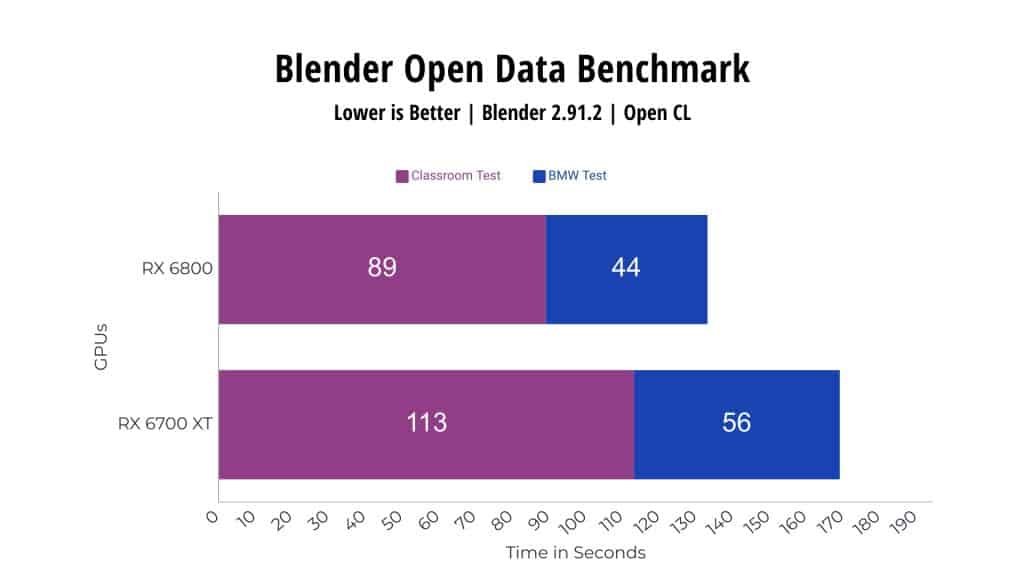
Blender is tested with the Open Data Benchmark with the BMW and Classroom tests using OpenCL. This one is more GPU dependent, and the 6800 is completing the longer Classroom test 27% faster than the 6700 XT.
SPECviewperf tests out a bunch of professional 3D workloads. The 6800 is ahead for the most part. However, the margins could vary quite a bit depending on the specific test.

Which One Should You Buy?
It comes down to what your budget is and what level of performance you’re targeting. I think the extra price for the 6800 is worth it, relative to the extra performance on offer.
